
Digital Marketing
From marketing data to decisions: building a feedback loop

Measuring is the easy part. Learning from what you measure, in the specific sense that last month's data changes this month's work, is harder. Reports get produced, presented and filed, and the next campaign can end up planned the way the previous one was.
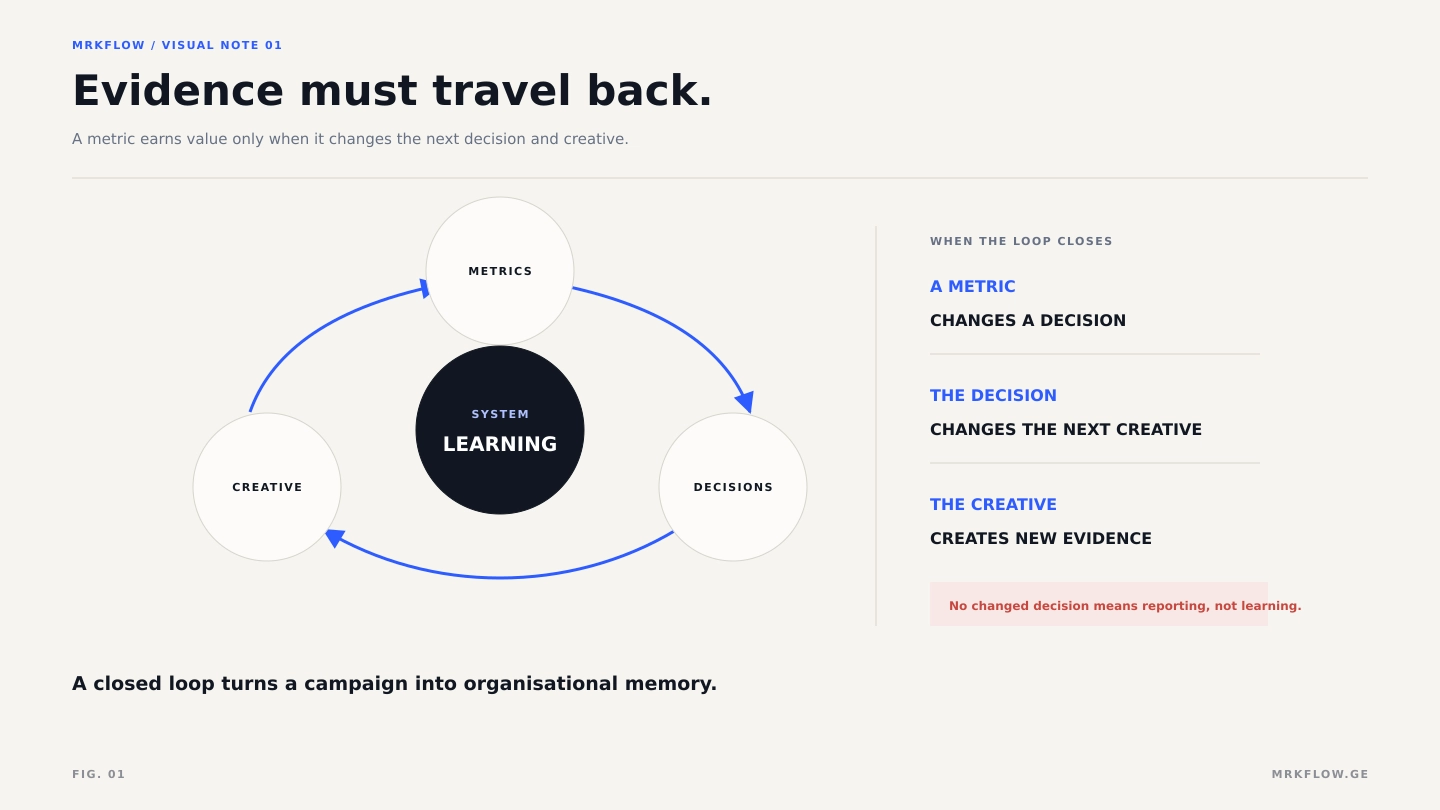
We call the missing piece evidence back: the deliberate return path from results to decisions. It is a loop with three connections, and each of them has to be built on purpose.
Connection one: metrics that map to decisions
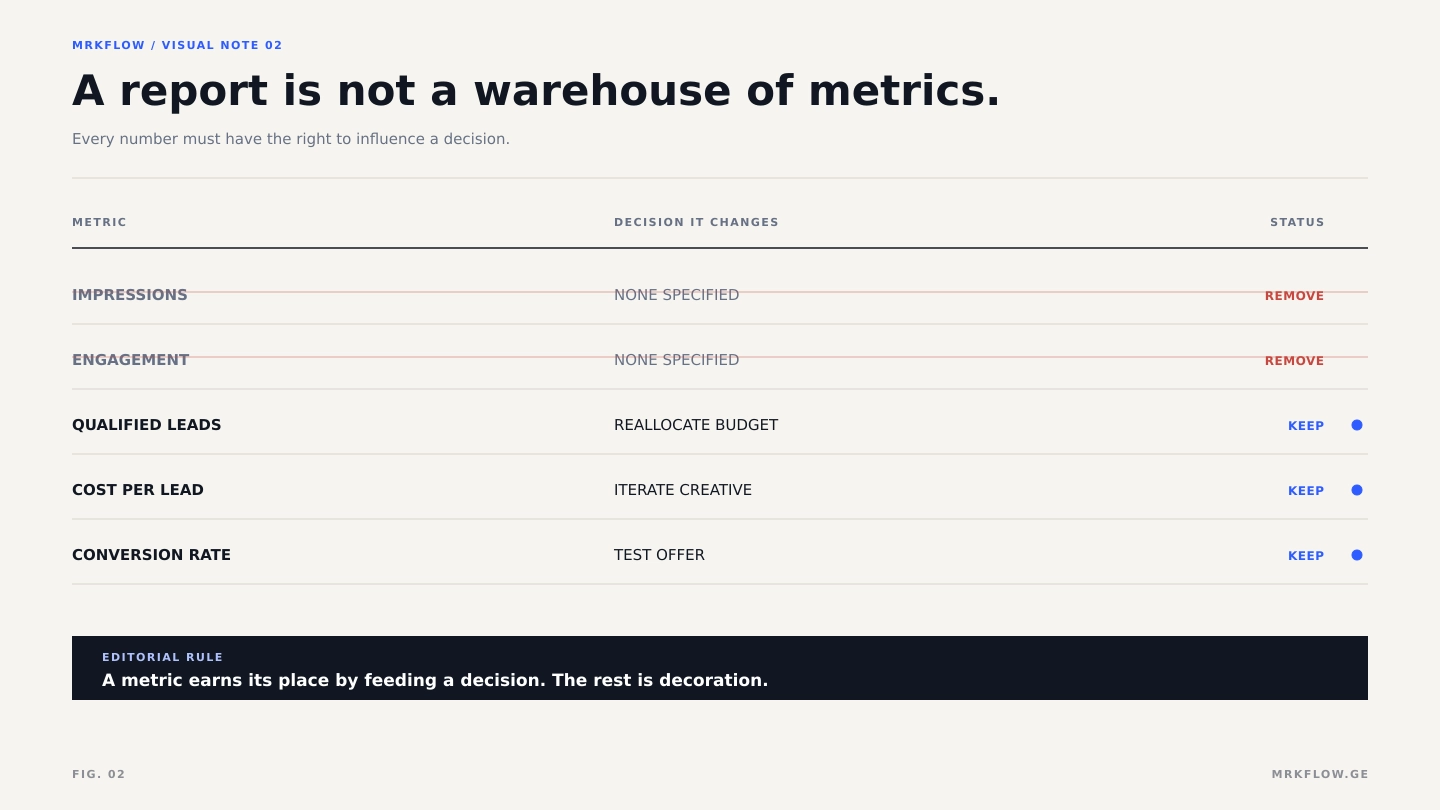
A metric earns its place in a report by answering the question: which decision changes if this number moves? Impressions alone may not pass this test. Cost per qualified lead passes it. Watch time on a specific format passes it. If no decision depends on a number, it is decoration, and decoration crowds out evidence.
The practical exercise: next to every metric in your report, write the decision it feeds. Delete the rows with blanks. The report can become shorter and more useful when each measure has a clear purpose.
Connection two: a scheduled decision meeting
Data does not act on its own. A team that wants to learn needs a fixed, short, recurring session (we run them monthly) with exactly three agenda points: what did we predict, what happened, what changes now. Not a presentation. A decision meeting, ending with changes written down and owned.
The prediction step matters more than it looks. Writing down what you expect before the campaign runs is a clear way to know whether you learned something or just narrated the outcome afterwards.
Connection three: a path back into creative
This connection needs a route of its own. Media data can easily stay in the media team. But a finding can be creative rather than technical: which message earned attention, which format got saved, which audience responded to which promise. Those insights are strategy and creative fuel, if a route exists to carry them there.
In our loop, every media review produces one section written for the brand and content teams, in plain language: "this claim outperformed that claim; this is what the audience keeps proving it wants." Creative work in the next cycle starts from that page.
Why loops beat campaigns
A campaign spends its budget and ends. A loop compounds: each cycle starts with more validated knowledge than the last, so the same budget buys better decisions over time. That compounding is bought with process, not spend.
Why the loop matters more than the dashboard
The strongest argument for measuring causally rather than descriptively is not a framework, it is an experiment that cost a large company a great deal of money to run.
In 2015 Blake, Nosko and Tadelis published a field experiment run at eBay: paid search was switched off across whole regions and the results compared with regions where it kept running. Brand-keyword advertising (the ads that appear when somebody searches your own name) had no measurable short-term benefit. For non-brand keywords, new and infrequent users were genuinely influenced, but frequent users, who accounted for most of the spend, would have bought anyway. Average returns came out negative, and the returns overall were a fraction of what eBay's own non-experimental analysis had reported.
Nothing was wrong with eBay's dashboards. They were measuring correlation between clicks and purchases, accurately, forever. The loop was missing the one connection that turns a number into evidence: a comparison with what would have happened otherwise.
The uncomfortable part: evidence is expensive
The obvious response is "so run experiments". Lewis and Rao looked at what that actually costs. Across twenty-five large advertising field experiments, the median confidence interval on return on investment was over 100 percentage points wide. To reliably tell a 50% return from a zero return, the median campaign would have needed to be nine times larger; to resolve a 10% difference, sixty-two times larger.
That is a genuinely awkward result and it is worth sitting with rather than skipping. It means most marketing decisions, at most budgets, cannot be settled by statistics alone. It does not mean measurement is pointless; it means the loop has to be built to learn from things other than significance tests.
What a small business does with that
Three moves, in descending order of value:
- Use the large, cheap comparisons. Pausing a channel and observing total inquiries can provide a useful signal, but seasonality, other campaigns and delayed conversions can affect the comparison. Where feasible, use a suitable comparison group, such as regions that keep the channel running (a geo experiment) or an ad platform's conversion lift study, and define the evaluation period in advance.
- Prefer decisions that survive being wrong. When the evidence cannot resolve a 10% difference, stop trying to optimize 10% differences. Spend the attention on the choices where the options differ by a factor, not a fraction.
- Write the prediction down. This costs nothing and guards against a common failure: narrating whatever happened as though it was the plan. Recording expectations makes later interpretation more disciplined, even when the team cannot run a controlled experiment.
What we put in the monthly review
Four things, and the meeting is not allowed to run past them: what we predicted, what happened, what we are changing, and who owns the change. If a metric appears in the pack that feeds none of the four, it comes out of the pack. This can make the review shorter and more useful by keeping attention on decisions and responsibilities. How we build that monthly review pack is on the analytics and reporting page.
FAQ
Frequently asked questions
What is an evidence loop in marketing?
It is the cycle in which measurement changes a decision, the decision changes the next piece of work, and that work produces new measurement. Reporting describes what happened; a loop changes what happens next. The difference is whether any number ever alters a plan.
Which metrics belong in a monthly report?
Include measures tied to decisions and the campaign's purpose. Qualified leads, cost per lead and conversion rate can support sales decisions; impressions and engagement can help assess reach, delivery and content response. Explain what decision each measure informs.
How long before a marketing change can be judged?
The timing depends on traffic, the outcome being measured, normal variation and the size of change you need to detect. Define the evaluation period and required sample before testing, then report uncertainty alongside the result.
What does a report look like when it is not working?
It is long, it is comprehensive, and nothing in it changed a decision. That is a record rather than a loop, and it is usually a sign the metrics were chosen for being easy to collect rather than for having consequences.

Free audit
Now let's look at your marketing.
Send us your website or main social profile. We will review the publicly available material and send a written assessment of strengths, issues and priorities.
Request free auditRead next
Terms used here: GEO (generative engine optimization) PPC (pay per click) Qualified lead Evidence loop Conversion Keyword